From 90 MW to 200 MW: How BIM Management Absorbed a Doubled Data Center


One day, our 90 MW data center project became a 200 MW one. The core team stayed almost the same. The project did not.
My company and I led the BIM side of that project - management and coordination across every discipline and every building on the site. This is the story of how we absorbed a scope that more than doubled overnight, what it did to our drawing set, and why the fix ended up as a set of Revit add-ins.
The pivot
The original scope was a “typical” hyperscale data center campus (as if there’s such a thing) : several ~100MW data centers, 4 auxiliary buildings, an HV substation, and site infrastructure. Missing a power plant, sure, but you can’t have everything.
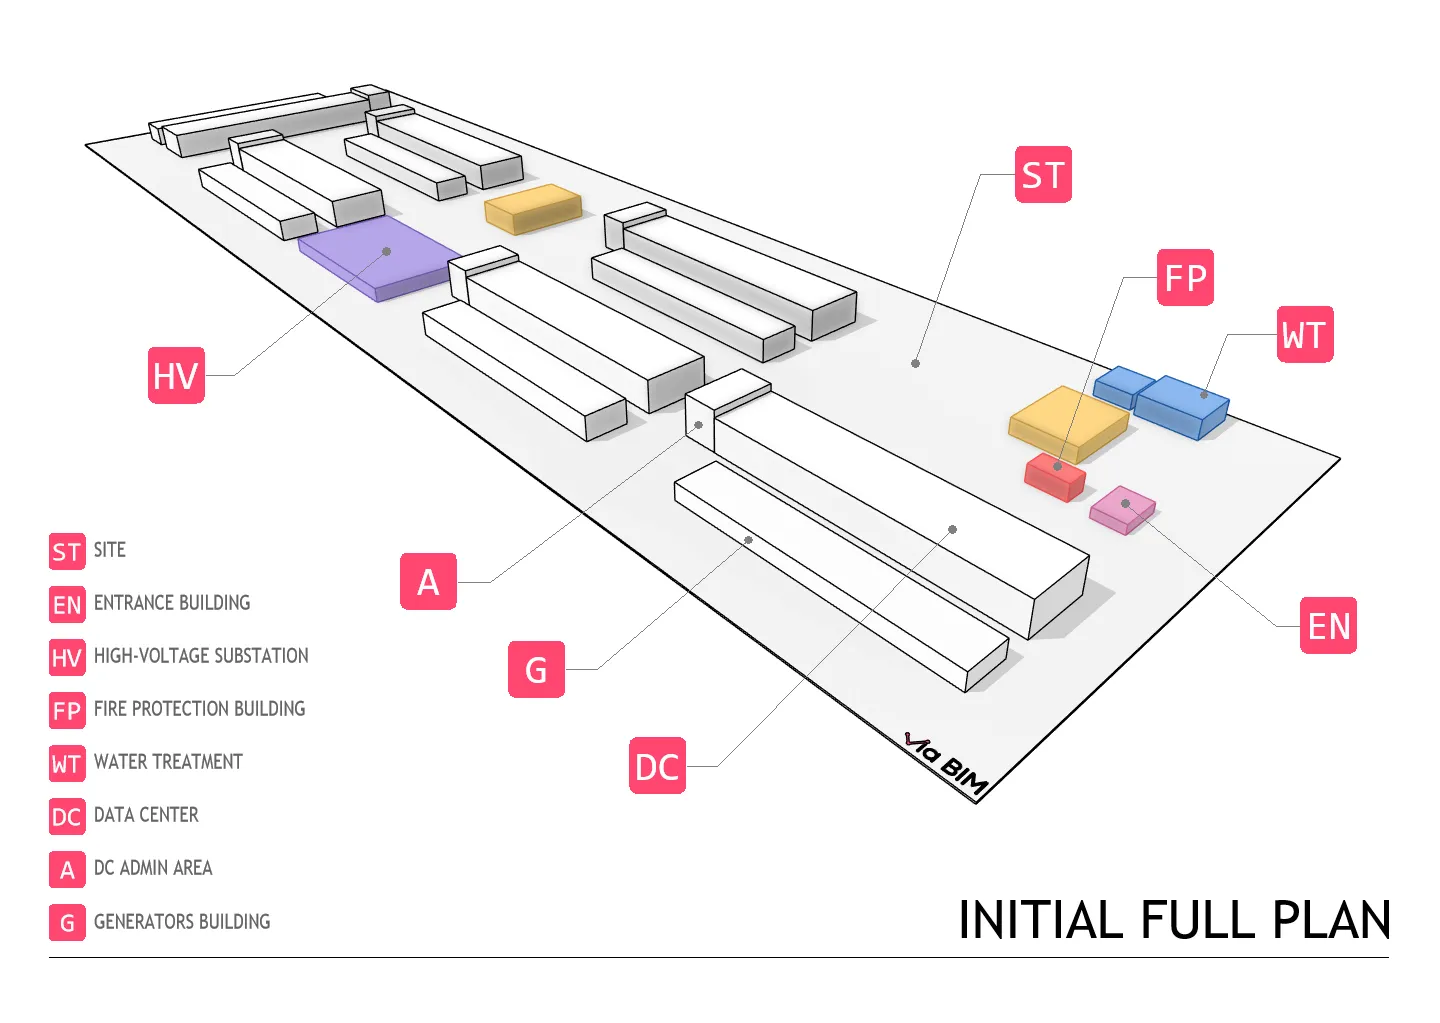
Phase 1 scoped that down to site infrastructure, 1 data center, the HV substation, and 2 essential auxiliary buildings. We delivered the DD set - phase done, or so we thought.
Then the client had to pivot: merge the two data center buildings into one. Capacity doubled overnight.
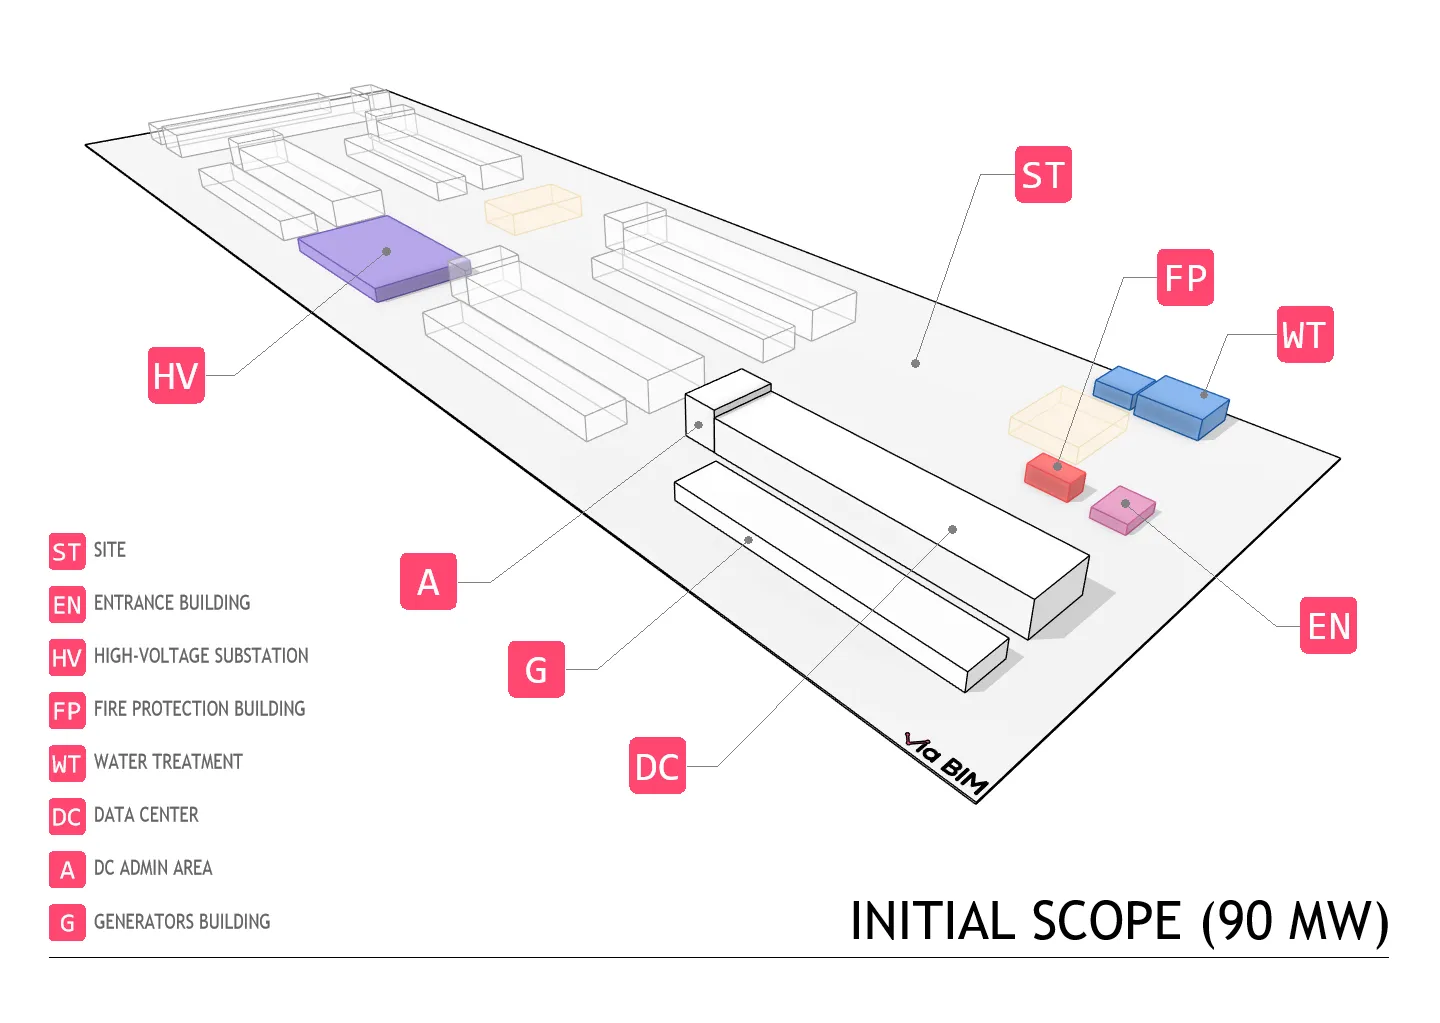
[Image: full campus plan with the initial Phase 1 scope highlighted - altered, simplified, not to real proportions]
The drawing problem
The first thing that hit us, before we’d even processed what it meant for the design, was the new drawing count.
For every level and every discipline, we used to have 1 overview sheet (≈1:250) and 8 sector sheets (≈1:100 - ARCH E for my American colleagues, roughly ISO A0 for the rest of us). After the change: 2 overview sheets and 21 sector sheets. A 2.5x increase.
And that’s before you factor in that “discipline” isn’t one line item. Electrical alone splits into equipment and power, grounding, lighting, and more - each with its own set of views to maintain across every sector and every level.
I like to say: “No matter how big the project gets, you always have exactly one week for drawing production. The last one.” Every efficiency we’d built into the BIM setup - across the whole Revit, Civil 3D, Navisworks and ACC stack, together with the design teams - suddenly looked like it was evaporating.
The design team added a couple of people, and it slowed us down before it helped. New to the project, not yet in sync with the rest of the team, with less than two months to pull this off. Brooks’ law, working exactly as advertised.
The setup we started with
Scope changes like this happen on projects of this type - they are not the exception. That’s exactly why we insist on standardization from day one.
On large projects with multiple buildings, each with its own set of teams and disciplines to coordinate, one of the most important Revit features is the scope box. As the name suggests, it’s simply a “box” in Revit that captures the space we’re working on. It constrains grids, levels, planes, and views. We fed its naming directly into sheet and view numbers, and used it to define the scope and boundaries of each view.
We proposed the positions and sizes of the scope boxes to the engineers, taking into account the drawing context and the specifics of each discipline. Initially there were 8, logically named 1-8.
We also standardized drawing numbers and (most) names in advance and defined the standard in the BIM Execution Plan (BEP). The sheet number and sheet name are aligned so that the name constructs and “explains” the number in sequence:
EL-2510.1 - ELECTRICAL LIGHTING LEVEL 01 PARTIAL PLAN - SECTOR 1
The part that matters here is the suffix: every sector sheet and view carries one, and it comes from the scope box. That was the setup - until the scope doubled and 8 sectors suddenly weren’t enough.
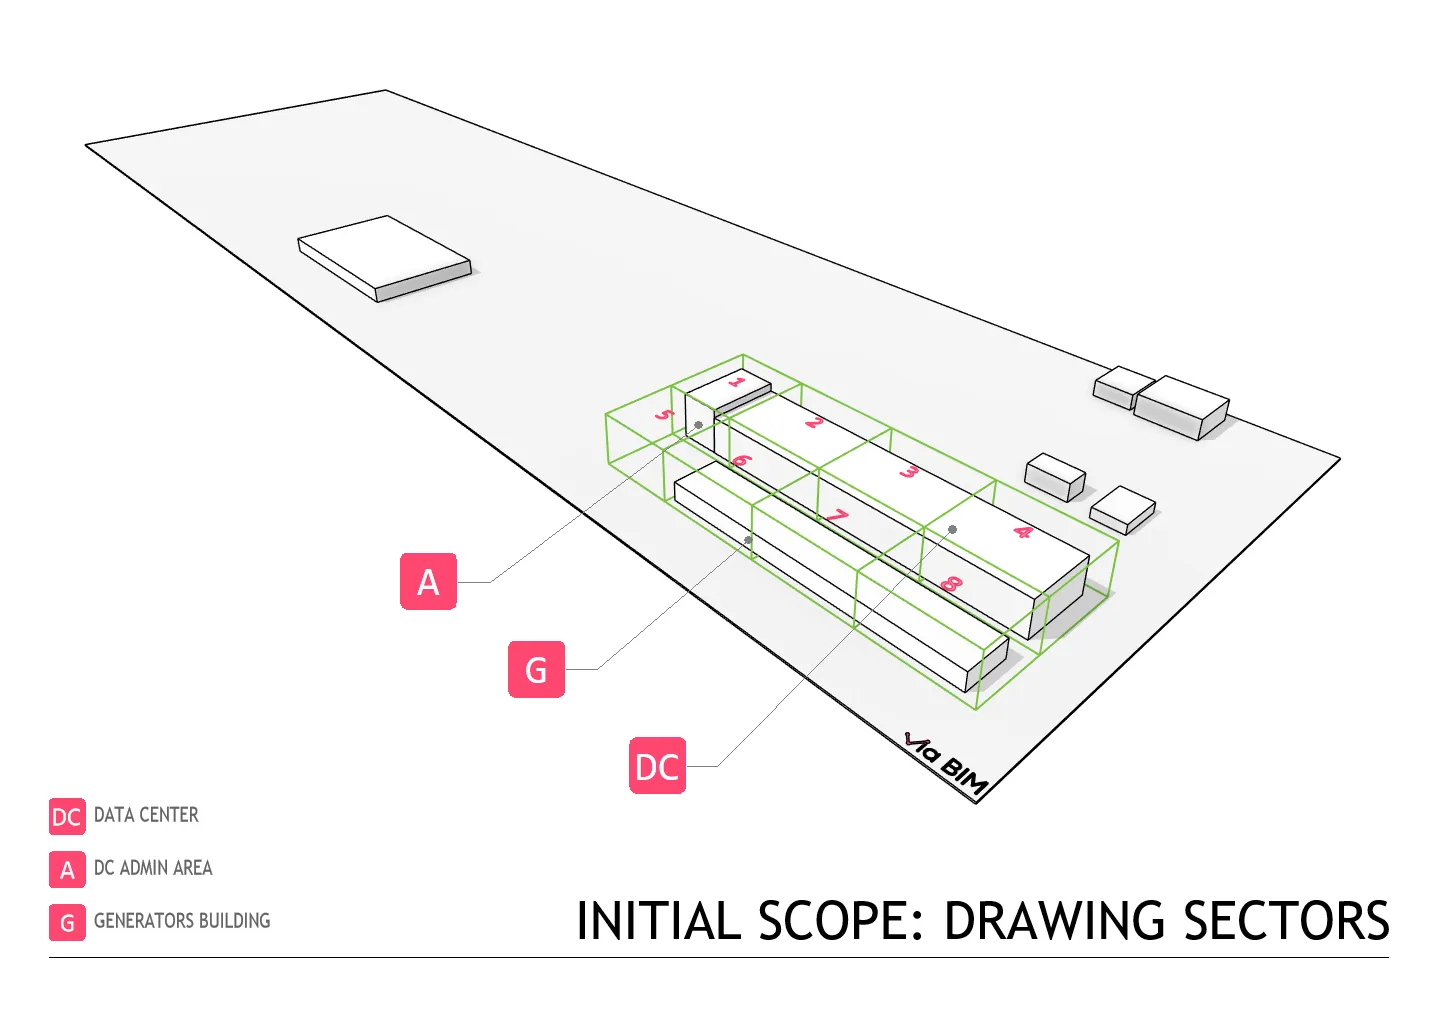
[Image: the original 8 Revit scope box sectors]
First cuts: from 2.5x to 2.0x
We made three changes before touching a single scope box:
- We cut the overview drawings from two per level at ≈1:250 down to a single one at ≈1:500.
- We agreed not to issue drawings with no content for a given discipline.
- We redefined the sectors and scope boxes across the whole building - keeping the sector (partial plan) views at ≈1:100 as before, and adding scope boxes for every remaining part of the building.
Together, these reduced the drawing count increase from ≈2.5x to ≈2.0x. Good, but not good enough. The time savings would have to come from somewhere else.
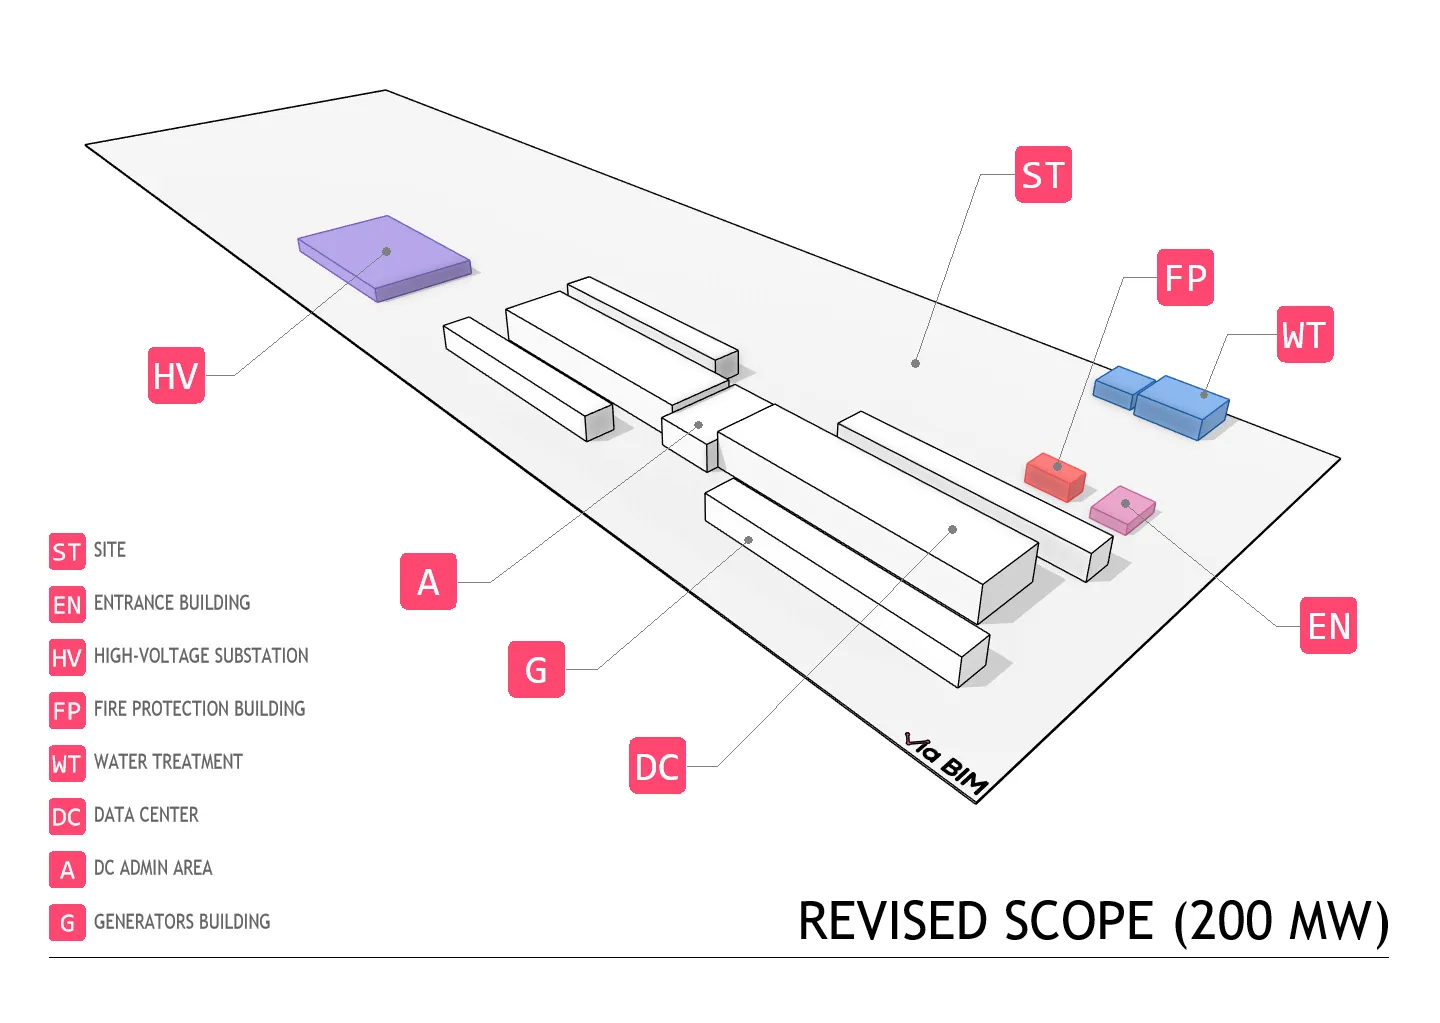
[Image: hyperscale data center campus revised phase 1 scope]
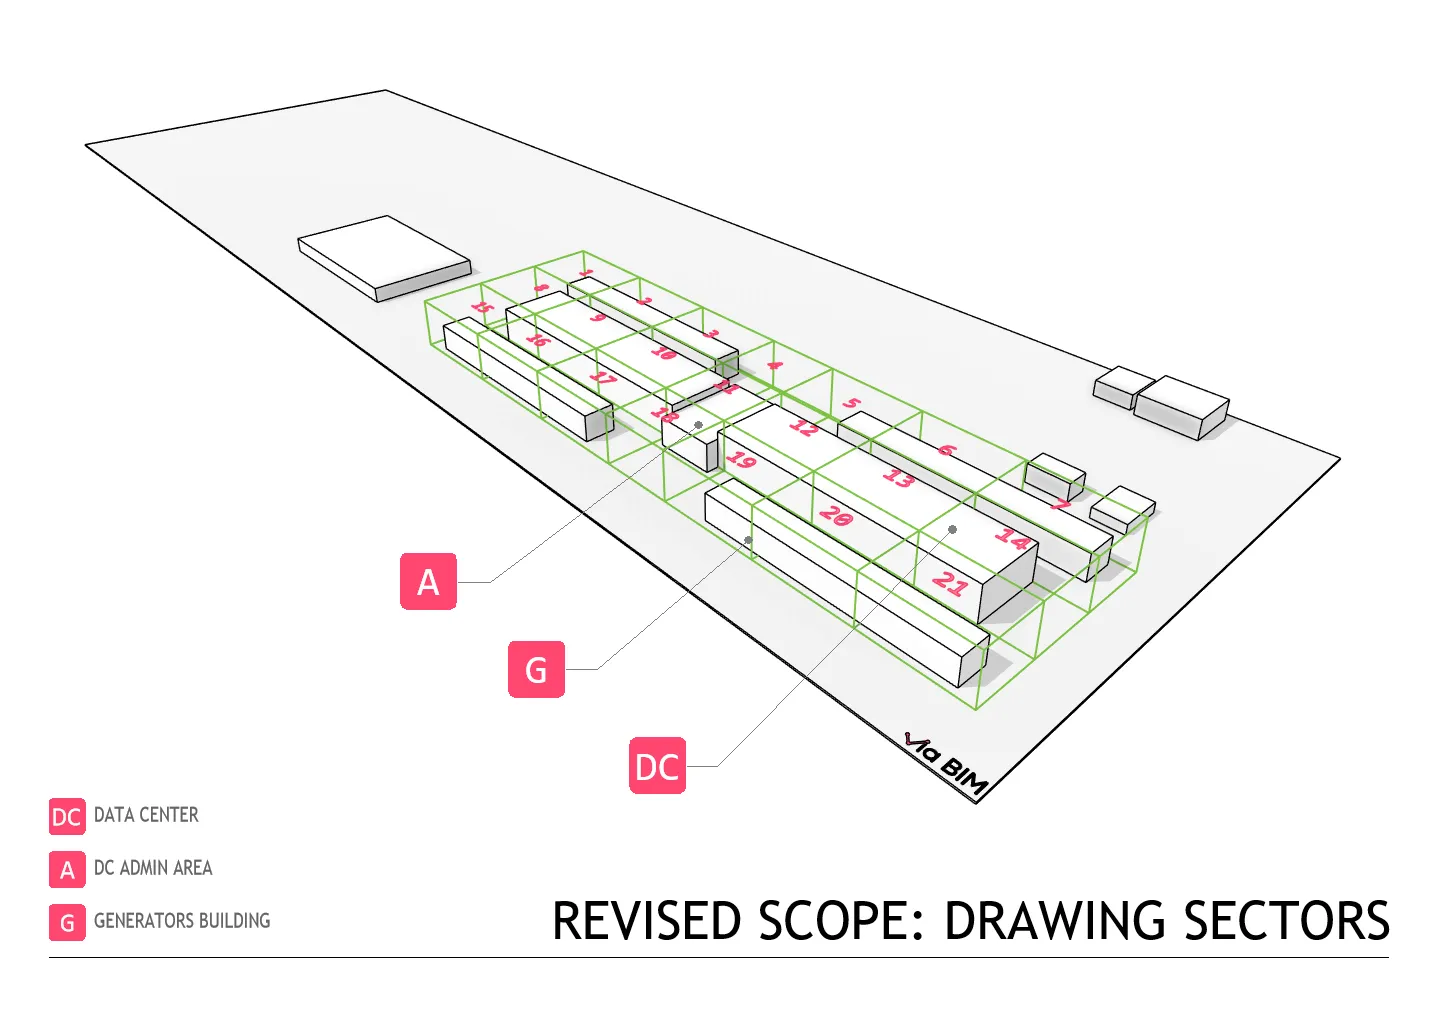
[Image: revised scope and how the scope boxes evolved]
Naming 21 sectors
We numbered the new sectors 1-21. Seemed logical. As Tyson would say, “Everyone has a plan…”
The first problem was sorting. Numbers above 10 don’t sort correctly as text, so sector drawings would go 1, 10-19, then 2, 20, 21, then 3, 4… We added a leading zero to numbers below 10 before that became a real issue.
Then came communication problems. Despite the leading zero, the “old” and “new” numbers no longer matched up. On top of that, a random number like sector 13 or sector 17 took a bit of mental counting before you could picture where it actually was. The building now looked like a butterfly, and the numbering didn’t follow that symmetry.
After several iterations chasing symmetry, we did what we usually do: combine letters and numbers. Letters carry more meaning for people than numbers do, especially once the numbers go above 6 or 7. So we introduced G11 for sector 1 of building G1, DR2 for the second sector of the right data hall, and so on. We also tried numbering by data hall, but multiple levels and a basement made that unnecessarily complicated.
After testing, meetings, and accounting for every edge case across 10 major disciplines, we finally had the new scope box layout - sectors defined and ready for implementation.
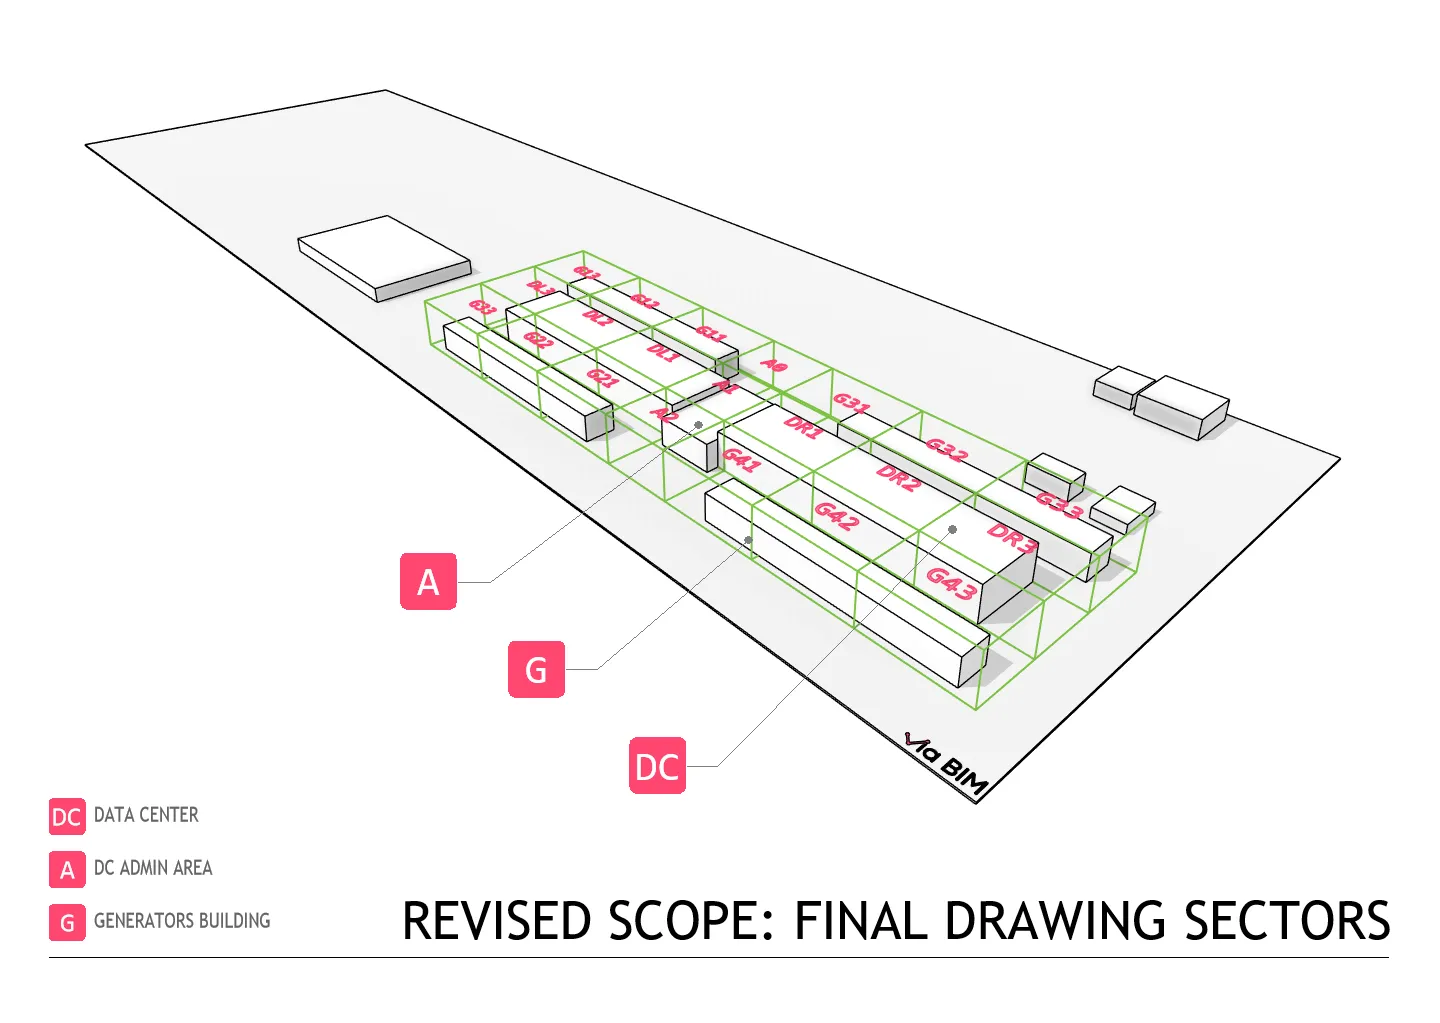
[Image: final sector layout with letter-based naming]
The math
The next problem was preserving everything already built under the original 8-sector setup. Every new sector meant a new scope box, new views, new sheets, correct naming and correct positioning - repeated for every discipline, every sub-discipline, every level.
So we did the math:
9 disciplines x 4 levels x 2.55 sub-disciplines x 13 new sectors = approx. 1200
That is roughly 1,200 repetitions of the whole process (Civil excluded, levels and sub-disciplines averaged). For MEP+T alone - Mechanical, Electrical, Plumbing and Telecommunications, the most sub-divided disciplines - it came to 676. At 20 minutes per sheet, that’s 226 hours just for MEP+T.
And that first round of new scope boxes wasn’t the last. Several more iterations followed, driven by discipline requests, design changes, and shifts in what the permit drawings needed to cover.
There was one more constraint we had set ourselves: sector and overall drawings for each discipline had to align exactly on paper. Print them on tracing paper, overlay them, and everything had to line up perfectly.
Automating it
Manual wasn’t an option. We mapped out the exact steps needed to preserve what was already there, then built automation for it - first as a Dynamo prototype for internal use and testing, then as Revit add-ins once it had to scale to the broader design team.
The result was a 12-step workflow for “translating” the old sector system into the new one. We handed it to the technical leads of each discipline, who ran it themselves with minimal support from the BIM side.
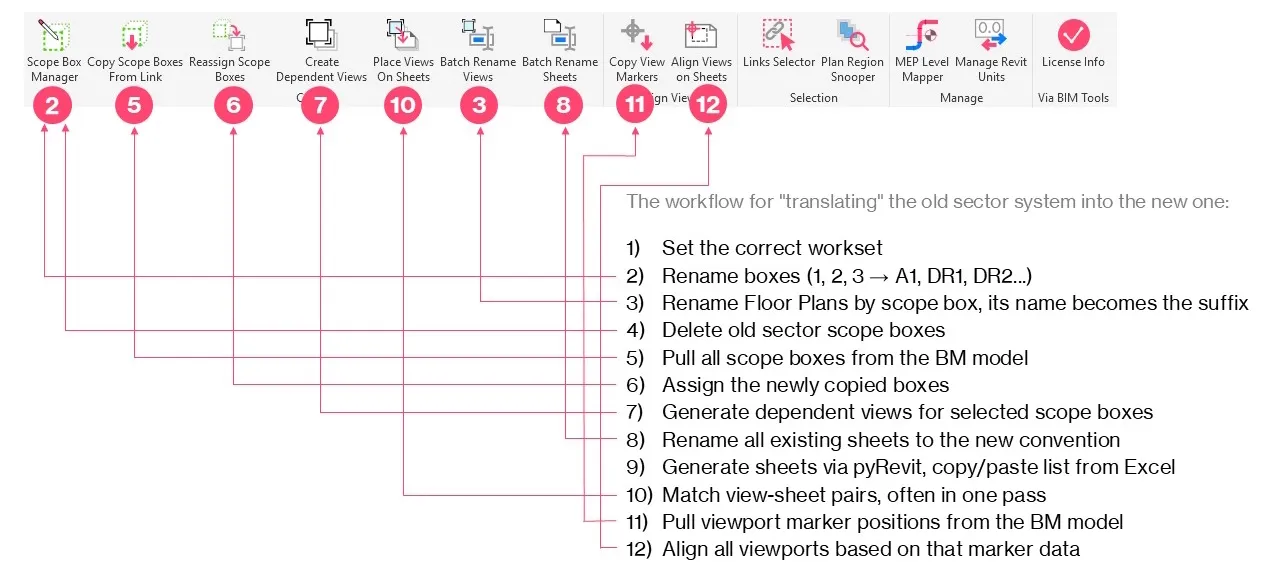
[Image: the 12-step migration workflow]
The fixes never stop, though. Later adjustments needed a shorter loop, so we reduced it to 3 steps.
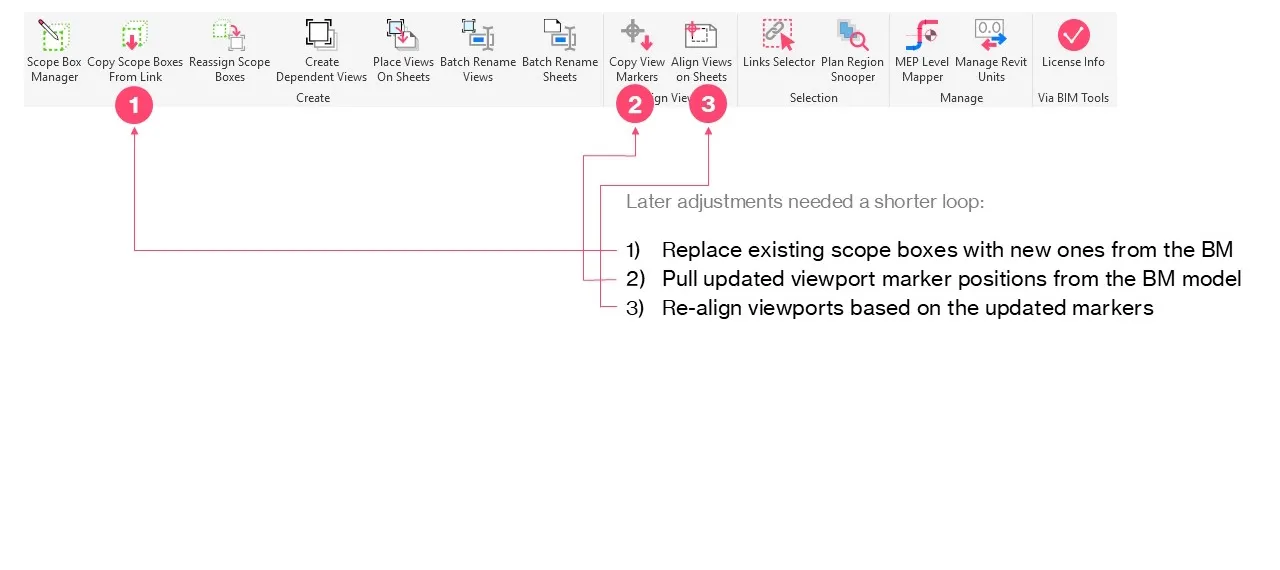
[Image: the 3-step adjustment workflow]
The backbone: the BM model
None of this would have been feasible to automate without one thing running underneath it all. Our BIM infrastructure - named positions and coordinates, grids, levels, scope boxes, matchlines, and more - was centralized and pulled from a single BM (BIM Management) model across every discipline.
We always work this way by design, so it was ready long before we needed it for automation. It was the quiet backbone of everything above.
The result: 226 hours down to about 2
For someone using these add-ins for the first time, the whole migration took under an hour per discipline. For MEP+T, that brought the 226-hour estimate down to about 2 hours - M+P shared one main data center model, E+T shared another.
Karlo, who ran the E+T disciplines, saw those numbers and put it simply: “Mirko, you are one crazy man!”
This wasn’t tested on a clean sample file. It ran on a live 200MW data center project: 42 Revit models, carrying every complication you’d expect - phases, worksets, design options, groups, linked models (some as attachments, some as overlays), even Single Line Diagrams and P&ID diagrams built entirely on core Revit features.
Where the tools are now
Drawings were the most visible part of a much bigger scope shift, but they made one thing clear: disciplined BIM management from day one is what lets a project absorb a change like this. That’s what we bring to every project of this kind.
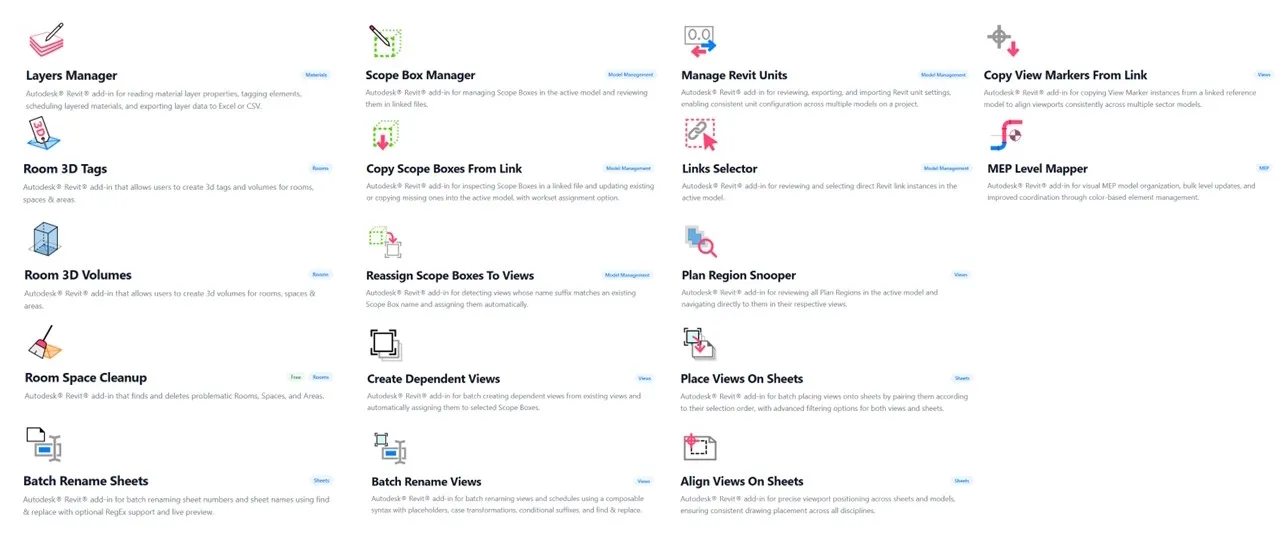
We built these add-ins under pressure, to get a live project through its deadline. Once the dust settled, we took the time to turn them into professional, production-ready software. Every tool and every installer is digitally signed, so you know exactly where it comes from and your IT team can verify it before anything touches your machines.
They are now available to everyone as Via BIM Tools - including Scope Box Manager, Copy Scope Boxes from Link, and Align Views on Sheets. Each comes with a 30-day free trial.
Working on a project where the scope keeps moving? Get in touch and we’ll show you how this could fit your BIM workflow.